.jpg)
Specs:
Easy-Food es una app intuitiva y eficiente que simplifica el registro y seguimiento de consumos diarios del personal. Con funcionalidades pensadas para agilizar el control y generar reportes automáticos, te ayuda a optimizar tiempos y recursos.
Con un diseño pensado para agilizar el control diario y ofrecer una visión completa de los patrones de consumo, Easy‑Food facilita la toma de decisiones y optimiza la gestión de recursos en cada área.
🧩 Características principales:
-
📲 Ingreso con código o QR
-
✅ Configuración manual o automática
-
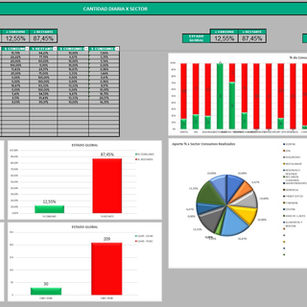
📈 Estadísticas y gráficos por usuario, sector y periodo
-
📤 Informes PDF mensuales por usuario o sector
-
☁️ Integración con Google Sheets y Power BI
-
👤 Carga y gestión de usuarios con foto y datos desde la app
📦 Ideal para empresas que necesitan:
-
📝 Registrar consumos diarios de manera segura
-
📈 Acceder a informes en tiempo real
-
👀 Controlar ingresos por sectores o turnos
-
📉 Reducir errores y duplicaciones
El programa Easy-Food para el control de consumos por parte de los empleados está compuesto por diferentes módulos que tiene diferentes funcionalidades, los mismo se detallan a continuación.
El programa Easy-Food para el control de consumos por parte de los empleados está compuesto por diferentes módulos que tiene diferentes funcionalidades, los mismo se detallan a continuación.
-
App: Ingreso y Egreso de Consumos, Seguimiento de Estadísticas de Consumo, Análisis x Sector, Graficas por Usuario y Sector de sus consumos, según hora, día, mes, año, etc.
-
Base de Datos en Google Sheets: Envió de información de la App y recepción de información generada por la App, Seguimiento de Estadísticas de Consumo, Análisis x Sector, Graficas por Usuario y Sector de sus consumos, según hora, día, mes, año, etc.
-
Power Bi: Seguimiento de Estadísticas de Consumo, Análisis x Sector, Graficas por Usuario y Sector de sus consumos, según hora, día, mes, año, etc.
-
Base de Datos en Excel: Seguimiento de Estadísticas de Consumo, Análisis x Sector, Graficas por Usuario y Sector de sus consumos, según hora, día, mes, año, etc.
-
Informes en PDF: Generación de informes en PDF x Mes, Sector y Usuario.
By simply entering consumption data through the App, all databases are updated automatically.

Easy-Food App Images
 |  |  |
|---|---|---|
 |  |  |
 |  |  |
 |  |  |
 |  |  |
 |  |  |
 |  |  |
 |  |  |
 |  |  |
 |  |  |
 |  |  |
 |  |  |
Consumption Database with Extra Tabs - Easy-Food

Power Bi Easy-Food - PC / Google Sheets


